
Cloud backends and dashboards: building the half that is not the device
Ingestion bursts, time-series storage and cardinality, retention, what really drives cloud cost, and dashboards designed around a decision rather than around the data.
In short
- Systems are usually built for the happy path and fail at the first outage, when a whole fleet reconnects at once.
- Message count drives cost more than data volume, because most services price per event.
- Cardinality is what breaks time-series storage, and it is easy to create accidentally.
- Out-of-order arrival is normal, not an error. Buffered data arrives after live data.
- A dashboard nobody opens is not a deliverable. Design for the decision, not for the data.
What the backend actually has to do
The requirement is usually stated as “collect the data and show it on a dashboard”, which understates the work considerably. A system that does this properly has to accept data from devices that come and go, survive them all arriving simultaneously after an outage, recognise duplicates, cope with readings arriving out of order, store enough history to be useful without accumulating unbounded cost, answer queries quickly over long time ranges, and present the result to several audiences who each want something different.
Most of that is invisible when the system is new and has ten devices reporting reliably. All of it becomes visible at scale, and the point at which it becomes visible is usually the point at which changing the architecture is expensive.
Ingestion, and the burst nobody plans for
The ingestion layer accepts connections and messages from devices. Sizing it for the average rate is straightforward and insufficient.
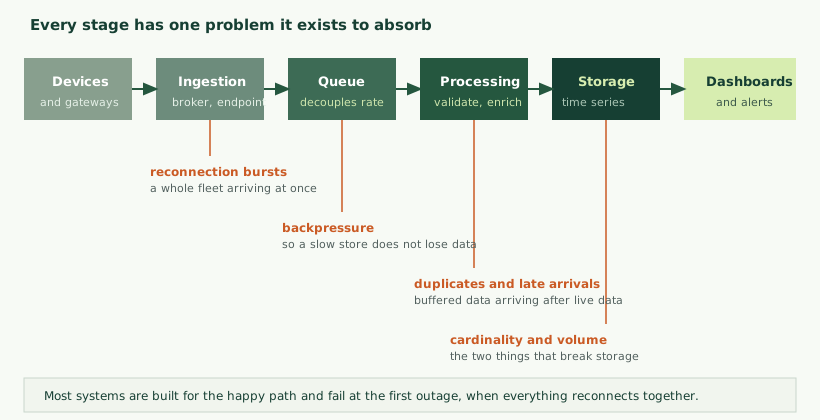
Consider what happens when connectivity is restored after an outage. Every device reconnects, and many of them have buffered data to deliver. A fleet that normally produces a steady trickle produces a surge, and the surge arrives precisely when the system has been idle and may have scaled down. This is the most common cause of a backend falling over, and it is entirely predictable.
Mitigations exist on both sides. Devices should back off with randomisation so they do not reconnect in unison, as discussed in choosing IoT connectivity. The backend should place a queue immediately behind ingestion so that accepting a message and processing it are decoupled, which allows the system to absorb a burst rather than refusing it.
The queue is what turns a spike into a backlog, and a backlog is a far better problem than lost data.
Processing: validation, deduplication, enrichment
Between arrival and storage, several things need doing that are easier here than anywhere else.
- Validation. Readings outside the physically possible, timestamps in the future, values from devices that should not exist. Catching these at the boundary keeps the store clean.
- Deduplication. Retries produce duplicates. Reliable deduplication needs a stable identifier per reading generated by the device, not an inference from timing, because two genuine readings can share a timestamp.
- Enrichment. Attaching the context that makes a reading interpretable later: which asset, which site, which firmware version, which product was running. Doing this at write time costs storage; doing it at query time costs joins. Which is preferable depends on how the data will be read, and it is worth deciding rather than defaulting.
- Quality flags. Where a device or protocol reports that a value is suspect, that should travel with the value rather than being discarded in favour of the number alone.
Storage: why general-purpose databases struggle
Device data has a particular shape. It is written far more often than it is updated, it is almost always queried by time range, it accumulates indefinitely, and it is usually read in aggregate rather than record by record.
A conventional relational database handles this adequately at modest scale and becomes awkward as it grows. Insert rates strain as indexes grow, queries spanning long ranges become slow, and deleting old data is an expensive operation that competes with writes. None of this is a defect; it is simply a different workload from the one such databases are optimised for.
Time-series stores address it with structures suited to append-heavy, time-ordered data: partitioning by time so old data can be dropped cheaply, compression that exploits the similarity of consecutive readings, and built-in aggregation and retention.
Cardinality, the thing that catches people out
The concept worth understanding before designing the data model is cardinality: the number of distinct series being maintained.
A series is identified by its measurement plus the set of labels attached to it. Ten thousand devices each reporting twenty metrics is two hundred thousand series, which is manageable. Add a label carrying the production batch, and every new batch creates a fresh set of series. Add another carrying a job number and the multiplication compounds. Several time-series stores degrade sharply beyond certain series counts, and the failure is usually memory exhaustion rather than gradual slowing.
The rule that avoids this: labels should hold values from a small, slowly-changing set. Anything with many possible values, or that changes constantly, belongs in the record as a field rather than as an identifying label, or in a separate table joined when needed.
Retention and downsampling
Keeping everything at full resolution forever is simple and eventually expensive. Keeping too little is cheap and irreversible.
The usual arrangement keeps recent data at full resolution, progressively downsampled aggregates for older periods, and events and findings indefinitely because they are small and their value grows with history. Downsampling should retain more than the average: minimum, maximum and count alongside the mean, because a peak that has been averaged away cannot be recovered and peaks are frequently what an investigation needs.
This parallels the retention discussion in SCADA and PLC integration, and the same principle applies: the small, high-value records are the ones to keep forever.
Designing the data model
This is the decision with the longest reach, because every consumer that follows depends on it and history accumulates in whatever shape you chose.
What identifies a reading
At minimum: which device produced it, which measurement it is, when it was taken, and the value. Several additions are worth considering deliberately rather than by accident.
- Device identity against asset identity. These are not the same. A device can be replaced while the asset continues, and a device can be moved to a different asset. Storing only the device identity makes the history of an asset impossible to reconstruct after a replacement, which is exactly when you want it.
- The timestamp source. Recorded at the device, or at ingestion. Both are useful and they differ, particularly for buffered data. Storing both costs little and resolves a great deal of later confusion.
- A quality indicator. Whether the value is trusted, estimated, or known to be suspect.
- A stable reading identifier generated by the device, which is what makes deduplication reliable.
- Firmware and configuration version. When behaviour changes across a fleet, being able to correlate it with a version is frequently the fastest route to the cause.
Units, and the confusion they cause
Store the unit alongside the value, or fix it absolutely in the schema and document it. Systems that assume everyone knows a temperature is in degrees Celsius eventually acquire a device reporting Fahrenheit, or a pressure in different units on one site, and the resulting errors are difficult to spot because the numbers remain plausible.
A related discipline is deciding where conversion happens. Converting at the device means the store holds one consistent unit and the device must be correct. Converting at query time preserves the original and pushes the problem to every consumer. Converting during processing, once, on the way in, is usually the best compromise, provided the original is retained.
Naming that survives
Measurement names will be used by every query, dashboard and alert built afterwards, and renaming them later means updating all of those plus reconciling historical data. Agreeing a convention at the start, applying it uniformly, and including the unit in the name are all cheap now and expensive to retrofit. This is the same discipline described for topic namespaces in industrial protocols.
Build or buy
| Approach | Strengths | Limitations | Suits |
|---|---|---|---|
| Managed IoT platform from a cloud provider | Fast to a working system, device management included, scales without effort | Per-device and per-message pricing, opinionated data model, migration cost later | Getting to market quickly, uncertain requirements |
| Specialist IoT platform | Domain features ready made, often good device management | Vendor dependency, cost at scale, limited customisation | Standard applications close to the product’s design |
| Assembled from components | Control over cost, data and architecture; no per-device fees | You operate it; more initial work | Large fleets, unusual requirements, cost sensitivity |
| On-premises | Data never leaves; no recurring cloud cost; unaffected by connectivity | Hardware, backups and updates are yours | Single sites, data residency requirements, industrial settings |
| Hybrid | Local resilience with central comparison | Two systems to keep consistent | Multi-site operations that must keep working when the link fails |
A reasonable pattern for many products is to begin on a platform, because it removes a large amount of work while the requirements are still unclear, and to plan for the possibility of migration by keeping your own data model rather than adopting the platform’s wholesale. The migration may never happen; the option costs little to preserve and is expensive to create later.
Starting small without painting yourself into a corner
Most of this article describes a system at scale. The first version rarely needs to be that, and over-engineering the backend for a fleet that does not exist yet is its own mistake.
A sensible first version can be simple: a managed broker, a single service that validates and stores, a conventional database, and a straightforward dashboard. For tens of devices this works, costs little and can be built quickly. The trap is not starting simple; it is starting simple in a way that cannot grow.
The decisions worth getting right even in a small first version, because they are the expensive ones to change, are these. Devices should have individual identities from the beginning, because retrofitting per-device credentials across a deployed fleet is painful. The data model should separate device from asset, and store both timestamps, since that information cannot be reconstructed later. Reporting should be on change with a heartbeat rather than on a timer, because changing it later means updating deployed firmware. And there should be a queue between accepting a message and storing it, even a trivial one, because that is the seam along which the system will later be split.
Everything else can be replaced later without touching the devices. The database can be migrated, the dashboards rewritten, the processing rearchitected, all while the fleet continues reporting. What cannot easily be changed is anything that requires the devices themselves to behave differently, which is why the short list above is worth the extra day it costs at the start.
What actually drives the cost
Cloud bills for device systems are frequently surprising, and the surprise is usually in a different place from the one anticipated.
- Message count. Most services price per event, so a device reporting every second costs sixty times one reporting every minute, regardless of how small the payload is. This is normally the dominant term.
- Storage that is never deleted. Small daily increments accumulate into a large monthly line, and nobody notices until it is substantial.
- Query patterns. A dashboard that scans a year of raw data every time it refreshes, for every viewer, consumes far more than one reading a precomputed aggregate.
- Egress. Getting data out is frequently charged, which matters for exports and for any migration.
- Per-device charges. Where a platform charges per connected device, fleet growth is linear cost growth, which changes the economics of a large deployment considerably.
The largest single reduction available on most systems is reporting on change with a periodic heartbeat, rather than on a fixed timer. On slow-moving industrial signals this routinely cuts message count by an order of magnitude without losing anything anyone was going to look at, and it reduces device energy at the same time, as covered in battery life in connected devices.
Dashboards that get used
Most dashboards are built by showing what the data contains. Good ones are built by asking what decision the viewer is trying to make, and showing what supports it.
The practical consequences are consistent across the systems we have seen work.
- One question per view. A screen answering “is everything normal” should look different from one answering “what happened last Tuesday”.
- Match the timescale to the audience. Someone on the floor needs now; an engineer needs the last few weeks; management needs months. Each is a different view rather than a different date range on the same chart.
- Make abnormal visible without reading. A person glancing at a screen should be able to tell whether anything needs attention without interpreting a number against a threshold they have to remember.
- Show context with every value. A reading alone invites the question “is that normal”, which the dashboard should already have answered by showing the expected range or the recent trend.
- Design for the screen it will be on. A wall display, a phone in a pocket and a desktop are different products, and a layout designed for one is poor on the others.
- Resist the temptation to show everything. Density is not information. The most used dashboards tend to be the sparest.
The test that matters is whether people open it without being asked. A dashboard that is demonstrated regularly and consulted never is a sign that it answers a question nobody has.
Alerting, and why it is harder than it looks
Every system of this kind eventually grows alerting, and it is where a great deal of accumulated frustration lives.
Alerts need state, not just conditions. A naive implementation evaluates a rule on each reading and notifies when it is true, which produces a notification on every reading while the condition persists. Alerts need a lifecycle: raised, acknowledged, resolved, with notification on transition rather than on state.
Flapping needs damping. A value oscillating around a threshold generates alternating alerts indefinitely. Requiring a condition to persist for a period before raising, and a wider margin before clearing, removes most of this.
A missing device is an alert. The absence of data is frequently more significant than any value, and a system that only evaluates rules against incoming readings will never notice a device that has gone quiet.
Related alerts should group. When a gateway fails, every device behind it goes quiet simultaneously. Sending fifty notifications for one fault is the fastest route to notifications being ignored.
Somebody has to own each alert. Notifications to a shared address that nobody specifically owns are reliably ignored. Routing to the system the responding team already uses works better than creating another inbox, as discussed in predictive maintenance.
Alert configuration is fleet management. Thresholds set per device across hundreds of devices need templating, inheritance and bulk editing, or they will be set once and never revisited.
APIs and getting data out
A system that holds operational data will eventually be asked to share it, and the request usually arrives with a deadline.
The requests that recur: a customer wanting their own data programmatically, an internal analysis team wanting bulk history, an integration with a maintenance or business system, and a regulator or auditor wanting records for a period. Each has different shape, and designing for them in advance is far easier than retrofitting.
Practical provisions worth building early: an interface for recent and current values, a mechanism for bulk historical export that does not compete with live ingestion for resources, a change notification mechanism so consumers need not poll, and consistent identifiers that are stable over time so an external system can rely on them.
It is also worth deciding, and stating, what happens to a customer’s data if they stop using the product. Being able to answer that clearly is increasingly a procurement question, and the answer is easier to give when the export mechanism already exists.
Reports, which are not dashboards
Dashboards answer “what is happening”. Reports answer “what happened”, and they are a different product with different requirements that gets built as an afterthought surprisingly often.
A report is read once, by someone who was not watching, possibly weeks later, and frequently has to be defensible. That makes several things matter that do not matter for a live view.
- It must be reproducible. Running the same report for the same period should give the same answer next month. If late-arriving data can change a figure that has already been circulated, that needs handling deliberately, either by waiting long enough before finalising or by versioning the report.
- The calculation must be explicable. Somebody will question a number, and “the system says so” is not an answer. Documenting how each figure is derived is what makes the report usable in a discussion.
- Gaps must be visible. A period during which a device was offline should be shown as missing rather than silently averaged over, because treating absent data as normal produces confident wrong conclusions.
- It should suit being read on paper or in an email. Reports circulate in ways dashboards do not, and an interactive view flattened into a static image usually loses the thing that made it useful.
- Scheduling and delivery matter. A report that requires someone to log in and generate it will be generated for the first month and then forgotten.
The distinction is worth making early because it affects storage. Reports look further back than dashboards, so they interact directly with retention and downsampling decisions. A monthly report covering a year of history needs a year of history at whatever resolution the report requires, which may be the constraint that sets your retention policy rather than the live view. Where the record is evidence rather than information, retention has further requirements.
Device management, which is half the system
Collecting data is the visible half. Managing the fleet producing it is the other, and it is consistently underestimated.
- Provisioning. Getting a new device recognised and authorised without manual work per unit.
- Configuration. Changing reporting intervals, thresholds or behaviour on deployed devices, reliably, including for devices currently offline.
- State. Knowing what each device is running, when it last reported, and what it believes its configuration to be, which is not always what you think you sent it.
- Update orchestration. Staged rollout, version tracking and the ability to stop a rollout quickly, as covered in device security and OTA updates.
- Health. Battery state, signal quality, error counters and restart counts, which are what let you find the few problem devices in a large fleet before they fail.
- Decommissioning. Removing a device cleanly, including revoking its credentials, which is easy to forget until a unit is stolen or sold.
A system with excellent dashboards and no device management becomes unmanageable at a few hundred units, because every operation becomes manual.
Design for the connection failing
Connectivity will be interrupted. Systems that treat this as exceptional behave badly when it happens.
Buffer at the edge, sized for a realistic worst-case outage, with a defined behaviour when the buffer fills. Accept late data throughout the pipeline, because buffered readings arrive after live ones and anything computing aggregates must cope with history arriving after the fact. Keep local function local: a plant display or a control decision that depends on a cloud round trip stops working when the link does, and frequently should not have depended on it. Distinguish silence from stability with a heartbeat, so a device that has stopped reporting is distinguishable from one whose value has not changed.
Who owns the dashboard once it exists
A system like this is never finished. Assets are added and removed, thresholds need adjusting, new measurements arrive, customers ask for a view that does not exist, and somebody has to keep the whole thing honest.
Programmes that decay usually do so for organisational rather than technical reasons. The person who understood the data model moves on. Nobody notices that a device has been reporting a stuck value for two months. A dashboard slowly accumulates panels that made sense once and now confuse people. Alert thresholds set during commissioning are never revisited as conditions change.
The remedy is modest but it has to be someone’s job: a periodic review of which devices are reporting and which are not, what alerts fired and whether they were useful, whether any views are unused, and whether the cost trend is behaving. An hour a month is usually enough, and its absence is what separates systems that are still trusted after two years from those that are quietly ignored.
The same applies to documentation. What each measurement means, what units it is in, how each derived figure is calculated, and which assets map to which devices. This is exactly the information that lives in one person’s head and leaves with them, and writing it down is the cheapest insurance available.
Security and separating customers
Two concerns recur. The first is the ordinary one: authenticated devices, encrypted transport, least privilege, and credentials that can be revoked individually. The second is isolation between customers, which applies whenever a single system serves more than one organisation.
Isolation can be enforced within a shared store through scoping every query, or through separate stores per tenant. The first is more efficient and depends on every query being correct; the second is more robust and more expensive. Whichever is chosen, choosing deliberately at the start is considerably cheaper than retrofitting separation onto a system that assumed a single tenant, which frequently means rewriting the data access layer entirely.
Also worth settling early: who owns the data, what happens to it if the customer leaves, and how it can be exported. These are commercial questions with architectural consequences, and they surface during procurement whether or not you have prepared for them.
Operating it once it is live
A backend is not finished when it works; it becomes something that has to be run. The operational requirements are modest but they are not zero, and systems built without them degrade in ways nobody notices until a customer asks a question.
- Monitor the pipeline itself. Ingestion rate, queue depth, processing lag and storage growth. A queue depth that is climbing is the earliest warning of almost every problem this kind of system has.
- Watch for devices that stop reporting as a system-level concern, not only per customer. A sudden change in the number of active devices usually means an infrastructure problem rather than many simultaneous device failures.
- Know the cost trend. Cloud spend rises with fleet and with history, and reviewing it monthly catches a query pattern or a retention gap before it becomes a large number.
- Back up what cannot be regenerated. Device configuration, asset relationships and maintenance findings are irreplaceable. Raw readings sometimes are too, and it is worth deciding which.
- Test the restore. A backup that has never been restored is an assumption.
- Keep dependencies current. The same supply-chain reasoning that applies to firmware applies here, as discussed in device security and OTA updates.
What breaks first, in our experience
Ranked roughly by how often it appears: the reconnection burst after an outage; storage growing faster than anticipated because nothing is ever deleted; a dashboard query that was fine with three months of history and is not with two years; cardinality creeping up through a label somebody added; and alert volume rising to the point where alerts are ignored.
All five are predictable and all five are cheaper to design for than to fix, which is the argument for spending a little longer on the architecture before the first device ships.
A worked example
A few hundred devices across several customer sites, reporting a handful of measurements every few minutes, with dashboards for the customer and a fleet view for the manufacturer.
A sensible shape: a managed broker for ingestion, a queue behind it, a processing stage handling validation, deduplication and enrichment, and a time-series store with recent data at full resolution and older data downsampled. Device identity per unit, with queries scoped by customer. A separate store for device state and configuration, because that data is small, frequently updated and not time-series in nature. Reporting on change with a heartbeat, to keep message count and device energy down. Dashboards split into a customer view showing their own assets and an internal fleet view showing health across all of them.
The decisions that matter most in that design are the data model and the reporting strategy, because both are difficult to change once devices are deployed and history has accumulated in a particular shape.
Edge, cloud, or both
How much processing happens on site and how much centrally is an architectural decision with consequences for cost, resilience and what is possible.
| Done at | Good for | Cost |
|---|---|---|
| The device | Immediate response, reducing transmission, working without connectivity | Constrained resources; harder to change once deployed |
| A local gateway | Aggregating several devices, buffering, protocol translation, local views | Hardware on site that somebody must maintain |
| A local server | Site-wide function that survives a link failure; data never leaves | Infrastructure, backups and updates become yours |
| The cloud | Comparison across sites, long history, heavier analysis, remote access | Recurring cost; dependent on connectivity |
The pattern that works for most industrial deployments is layered: enough intelligence at the device to reduce transmission, a gateway that buffers and translates, a local capability for anything the site depends on continuing, and central storage for comparison and history. That arrangement keeps the plant working when the link fails, which is the requirement most often discovered late.
The question worth asking for each function is simple: what happens to this if the internet is unavailable for a day. Anything whose answer is unacceptable belongs on site, and the rest can be central. Deciding that explicitly, function by function, produces a better architecture than deciding it once for the whole system.
The device end of this is covered in edge AI on microcontrollers and the plant end in legacy machine retrofit.
Mistakes worth avoiding
- Sizing for the average rate. The reconnection burst is what breaks systems.
- No queue behind ingestion. A slow store then becomes lost data.
- High-cardinality labels. Easy to add, hard to undo, and they break the store.
- Assuming time-ordered arrival. Buffered data arrives late by definition.
- Reporting on a timer when change would do. The single largest avoidable cost.
- Dashboards querying raw history on every refresh. Precompute what is viewed often.
- No retention policy. Storage grows quietly until it is a line item.
- Leaving device management until later. It becomes unmanageable at a few hundred units.
- Single-tenant assumptions in a multi-tenant product. Expensive to unpick.
How we help
- Architecture. Ingestion, queueing, processing and storage sized for the real message rate including bursts, with a data model that will still work at ten times the fleet.
- Backend development. Services, APIs and the processing that turns readings into something interpretable.
- Device management. Provisioning, configuration, state and fleet health.
- Dashboards. Separate views for the audiences who will actually use them.
- Cost modelling. Establishing what the system will cost at target scale before committing to an approach.
- Integration. Into existing systems, so the data reaches where decisions are made. See SCADA and PLC integration.
The service page for this work is cloud and dashboard development, and the device side is covered in IoT development.
Estimating what it will cost before you build it
Cloud cost is difficult to intuit and easy to model roughly, and doing the arithmetic early frequently changes the design.
Start from message count, since that usually dominates. Devices multiplied by messages per device per day gives the daily event count, and that number multiplied by whatever your chosen service charges per event gives the largest single line. Doing this for the target fleet rather than the pilot is the important part, because the pilot is always affordable.
Then storage. Bytes per reading, multiplied by readings per day, multiplied by retention in days, gives the volume held. Add the overhead of indexes and replication, which is not negligible. Then consider what proportion of that is at full resolution against downsampled, because that single decision often changes the total by an order of magnitude.
Then query cost, which depends on how many people open dashboards, how often they refresh and how much history each view scans. A dashboard on a wall display refreshing every thirty seconds for a year is a substantial number of queries, and if each scans raw history the cost is disproportionate to its value.
The exercise usually produces one of two reactions. Either the number is comfortable, in which case proceed. Or it is not, in which case the levers are the same three every time: report less often, retain less at full resolution, and precompute what dashboards read. All three are much easier to apply at design time than after devices are deployed and history has accumulated.
A short glossary
| Term | Meaning |
|---|---|
| Ingestion | The layer that accepts connections and messages from devices. |
| Backpressure | The mechanism by which a slow consumer causes the system to slow intake rather than lose data. |
| Time-series database | A store optimised for append-heavy, time-ordered data, with partitioning, compression and retention built in. |
| Cardinality | The number of distinct series being stored. Multiplies with every label attached to a measurement. |
| Downsampling | Reducing resolution of older data by storing aggregates, retaining minimum and maximum as well as mean. |
| Retention policy | The rule determining how long data is kept at each resolution. |
| Device shadow | A stored representation of a device’s last known and desired state, allowing configuration to be queued for a device that is offline. |
| Idempotency | The property that processing the same message twice has the same effect as processing it once. What makes deduplication reliable. |
| Multi-tenancy | One system serving multiple customers, with isolation between their data. |
| Heartbeat | A periodic message sent regardless of change, so that silence can be distinguished from stability. |
If you take one thing away
The device usually gets the engineering attention because it is the visible, difficult, physical part. The backend gets built to make the demonstration work and then has to carry a fleet for years.
Three decisions made early determine most of what follows: how often devices report, because it drives cost and energy simultaneously; what the data model looks like, because every consumer depends on it and history accumulates in that shape; and whether the system assumes connectivity is reliable, because it is not.
None of those is expensive to get right at the start. All of them are expensive to change once devices are in the field, which is also why security obligations are best designed for rather than retrofitted. Where storage and dashboards sit among the five layers is set out in what industrial IoT actually is.
Questions we are asked about this
What clients ask before starting
Can we use a normal database for device data?
For modest volumes, yes, and starting there is often sensible. The difficulties appear as insert rate and history grow: time-bucketed queries over long ranges become slow, indexes grow faster than expected, and retention becomes a manual chore. Time-series stores exist because those problems are predictable.
Should we build it or buy a platform?
It depends on how standard your requirements are and how much control you need over cost and data. Platforms are much faster to a working system and constrain you later; custom costs more initially and keeps the architecture and the data in your hands. Many products start on a platform and migrate once the requirements are clear.
What actually drives cloud cost?
Usually message count rather than data volume, because most services price per event. After that, storage that is never deleted, and query patterns that scan more history than necessary. Reporting on change rather than on a timer is frequently the single largest cost reduction available.
What is cardinality and why does it matter?
It is the number of distinct series being stored, which multiplies with every label you attach to a measurement. Adding something like a batch identifier to every reading can multiply series count enormously, and several time-series stores degrade badly when it does.
Do we need the cloud at all?
Not always. Where all the consumers are on site and the data does not need to leave it, a local server is simpler, cheaper to run and unaffected by connectivity. The cloud earns its place when data must be reached from elsewhere, compared across sites, or retained beyond what local hardware supports.
How long should we keep the data?
Longer for small, high-value records such as events, faults and maintenance findings, which stay useful for years. Shorter at full resolution for high-rate measurements, which are usually better downsampled after a period. The decision is irreversible in one direction, so it is worth making deliberately.
How do we handle data arriving out of order?
By expecting it. A gateway that buffered during an outage will deliver older readings after newer ones, and any store or aggregate that assumes time-ordered arrival will either reject them or produce wrong results. This is normal behaviour rather than an error condition.
Can customers see only their own data?
Yes, and how that isolation is implemented is a design decision worth making early. Retrofitting proper separation onto a system that assumed a single tenant is substantially harder than building it in.
What has to reach whom?
Tell us roughly how many devices, how often they report, who needs to see the result and where. If there is an existing system the data has to join, that shapes the answer.